Overview of Video Analysis Project
I was always taught to start with evidence based practice which then develops with experience to practice based evidence. Over the years having gone through the qualifications, CPD and experience of working in multiple sports and the last four years in climbing it is now time to get some of my own evidence back out there to help us further understand climbing and take the sport to new levels.
It has been really exciting to team up with German coach Udo Neumann, academics from St Mary’s University Twickenham and Derby University as well as collaborating with coaches nationally and internationally to get this video analysis project off the ground.
The aim is fairly broad, to further understand movement in climbing using the latest in video analysis technology. In more detail both myself and Udo are fascinated by the works of Frans Bosch and his application of Dynamic Systems theory which looks at how we store motor programs to the application of climbing.
In this research we aim to look at the key attractors that make good performance so we can understand technique development from a strength and stability point of view as well as a technical point of view.
Video Analysis Pilot Study
The study is made up of three parts, the first two pilot studies to get to grips with the available technology, analysis methods and possible errors in order to be fully prepared for part 3, heading to the Lead World Cups in Chamonix and Briancon to collect as much data as possible.
This article aims to look at initial findings from the 2ndanalysis a Youth C international competition. In this we analysed 5 competitors on one route, asking ourselves whether we could differentiate performance from analysing hip position in relation to the foot (ankle). In this we aimed to look at trends in the hip position rather than just the move they fell off on. So ideally the better climbers would have hip positions closer to the foot and those with worse hip positions further away from the foot.
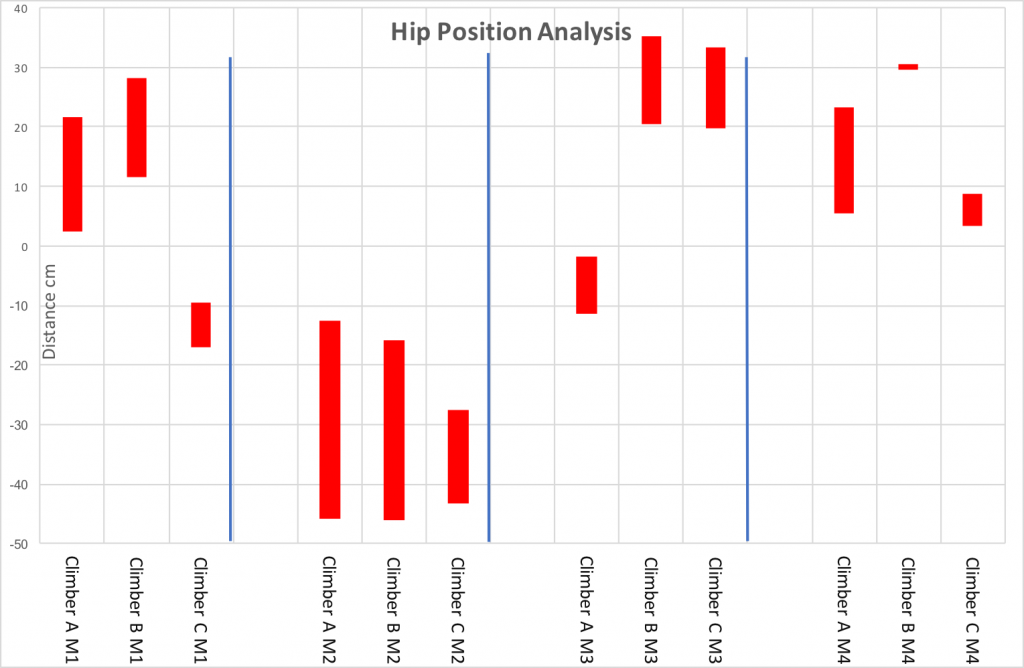
In Graph 1 we look at 3 climbers across 4 moves, in this we are looking for the climber with the hips closest to the ankle, here we see climber A with the hip closest to Zero in 3 out of the 4 moves with Climber C the 2ndclosest and Climber B the furthest from Zero in 3 out of 4 moves. In this example Climber C had the best performance followed by A then B. So, although the data didn’t differentiate between the top two it did differentiate between the top performers and the third-place performer.

Analysis of 3 Climbers across 4 moves.
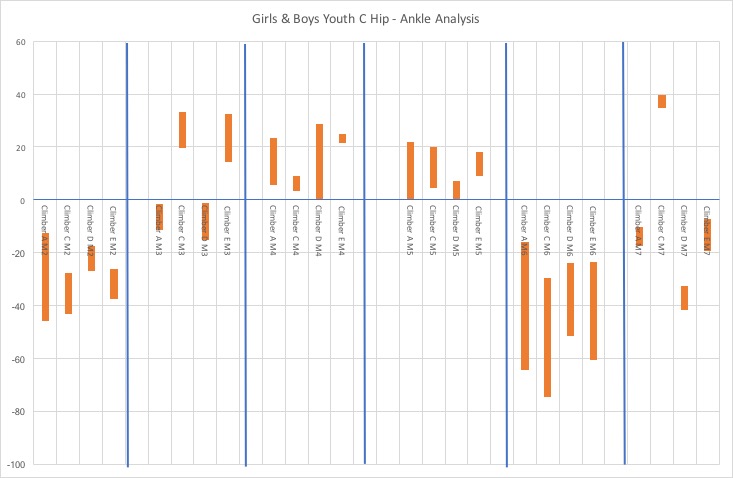
In Graph 2 we bring in two top performing male climbers (D & E)into the analysis, here climber D was the better performer overall in the competition (both topped this route) and in this graph his results support our hypothesis and his hip is closer to Zero than climber E in 4 out of the 6 moves.

Hip Position of 4 athletes across 6 moves
One interesting trend in the data is that the highest performing athletes (Climbers C & D) both had a smaller range of motion than the lesser performing athletes (A & E). This would be very interesting to analyse further and could be a number of different possibilities.
– Anthropometric, taller climbers have to move less
– Stronger climbers can hold more stable positions so move less
– Smaller movements are far better for energy efficiency so better technique
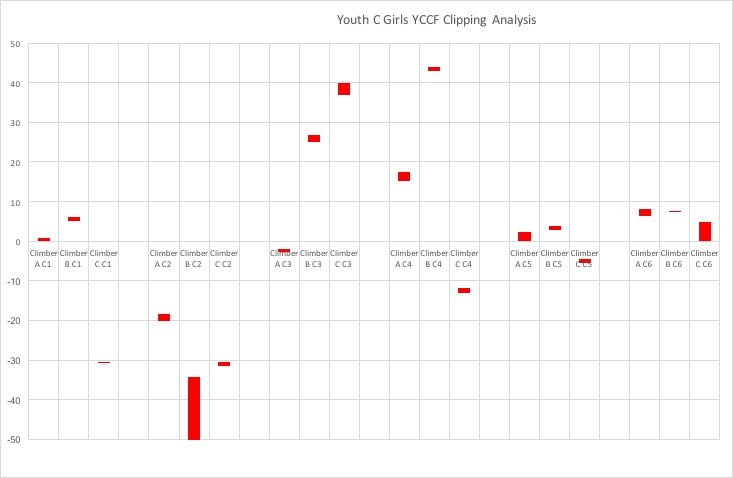
Our final analysis in Graph 3 looks at clipping position for the first 3 athletes across the first 6 clips. At the moment little can be drawn from this analysis, Climber A once again appears to have the better hip position while Climber C has in general the smaller range of motion. Climber B appears to have a reasonable clipping position with although in none of the clips was she closest from Zero and in 3 she was the furthest.

Clipping Position of 3 athletes across 6 clips
What will be interesting in the next analysis from the World Cups is if any of these trends are still visible and if they change as with fatigue / pressure during the competition.
The plan from here is to work closely with some of these athletes’ coaches to see if small changes to strength and conditioning or technique can yield improved results. Also, measuring key strength and functional movement scores and any correlation with the data.

High and Low values of athletes hip position in relation to ankle showing Range of Motion